
Insights has three tabs over a date range you pick.
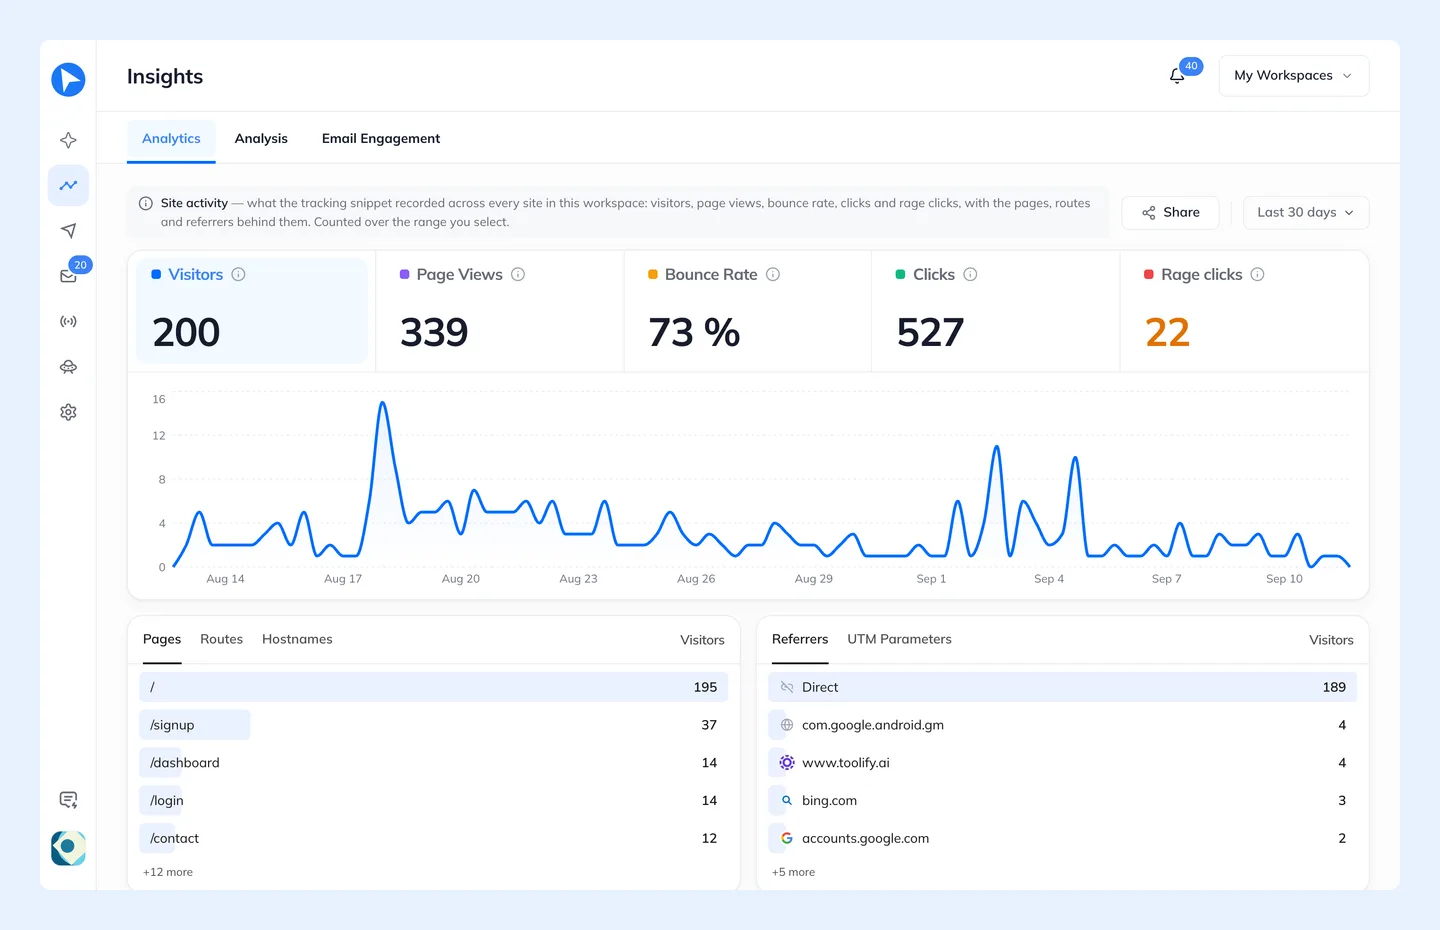
- Analytics
- Audience size and growth, activity over time, and how users break down by segment. *How many, and moving which way.*
- Analysis
- What the behaviour means — the funnel, a re-engagement breakdown, and median time to re-engage. *Why it is moving.*
- Email Engagement
- Email performance, segment performance and top-performing campaigns. *What your sending did about it.*
Charts can be shared out of Insights, and the Heatmap button here opens the overlay on your tracked site.